Manage Scrapoxy with a GUI
Connect
You can access to the GUI at http://localhost:8889/
Login

Enter your password.
The password is defined in the configuration file, key commander.password.
Dashboard
Scrapoxy GUI has many pages:
Instances. This page contains the list of instances managed by Scrapoxy;
Stats. This page contains statistics on the use of Scrapoxy.
To login page redirects to the Instances page.
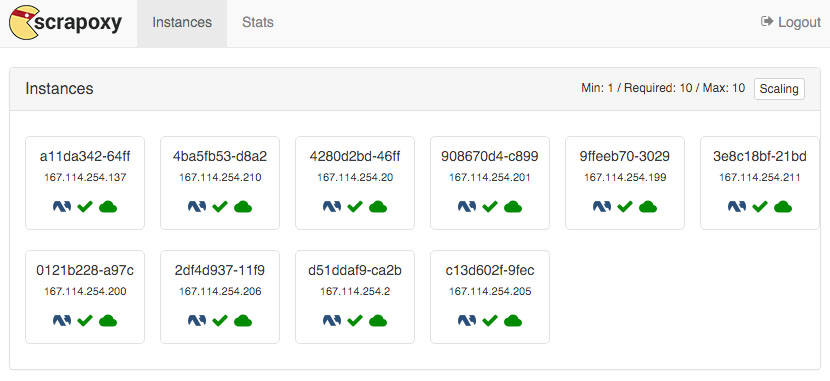
Page: Instances
Scaling

This panel shows the number of instances.
Scrapoxy has 3 settings:
Min. The desired count of instances when Scrapoxy is asleep;
Max. The desired count of instances when Scrapoxy is awake;
Required. The count of actual instances.
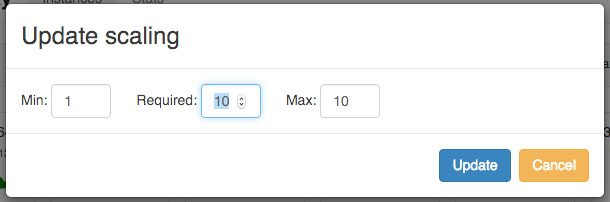
To add or remove an instance, click on the Scaling button and change the Required setting:
Status of an instance
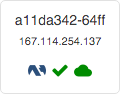
Each instance is described in a panel.
This panel contains many information:
Name of the instance;
IP of the instance;
Provider type;
Instance status on the provider;
Instance status in Scrapoxy.
Scrapoxy relays requests to instances which are started and alived
( +
+  ).
).
Type of provider
|
AWS / EC2 |
|
OVH Cloud |
|
DigitalOcean |
|
VScale |


Status in the provider
|
Starting |
|
Started |
|
Stopping |
|
Stopped |


Status in Scrapoxy
|
Alive |
|
Dead |

Remove an instance
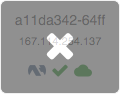
Click on the instance to delete it.
The instance stops and is replaced by another.
Page: Stats
There are 3 panels in stats:
Global stats. This panel contains global stats;
Requests. This panel contains the count of requests;
Flow. This panel contains the flow requests.
Global
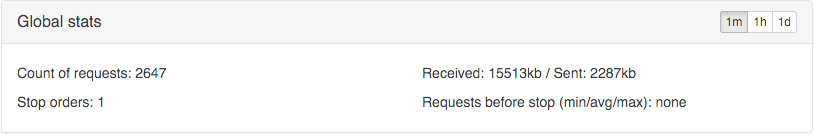
This panel has 4 indicators:
the total count of requests to monitor performance;
the total count of received and sent data to control the volume of data;
the total of stop instance orders, to monitor anti-blacklisting;
the count of requests received by an instance (minimum, average, maximum) to check anti-blacklisting performance.
Requests
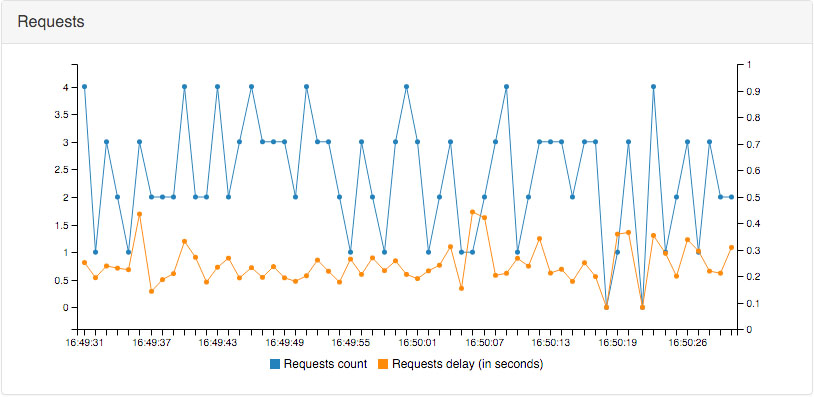
This panel combines 2 statistics on 1 chart.
It measures:
the count of requests per minute;
the average execution time of a request (round trip), per minute.
Flow
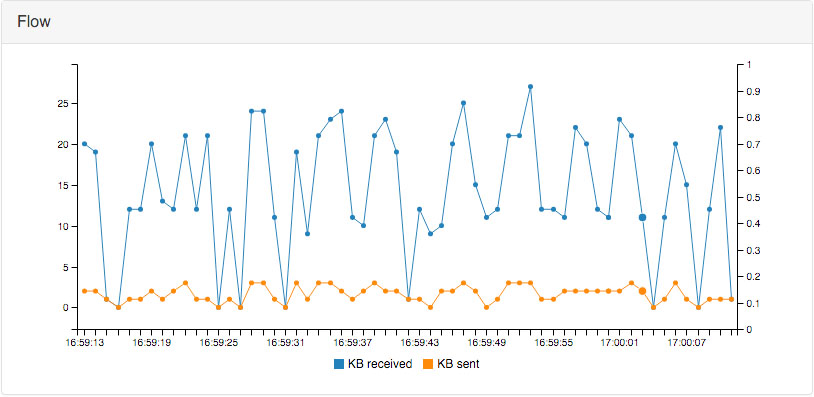
This panel combines 2 statistics on 1 chart.
It measures:
the flow received by Scrapoxy;
the flow sent by Scrapoxy.
How to increase the number of requests per minute ?
You add new instances (or new scrapers).
Do you increase the number of requests par minute ?
Yes: Perfect!
No: You pay instances for nothing.
Do I overload the target website ?
You add new instances (or new scrapers).
Did the time of response increase ?
Yes: The target website is overloaded.
No: Perfect!